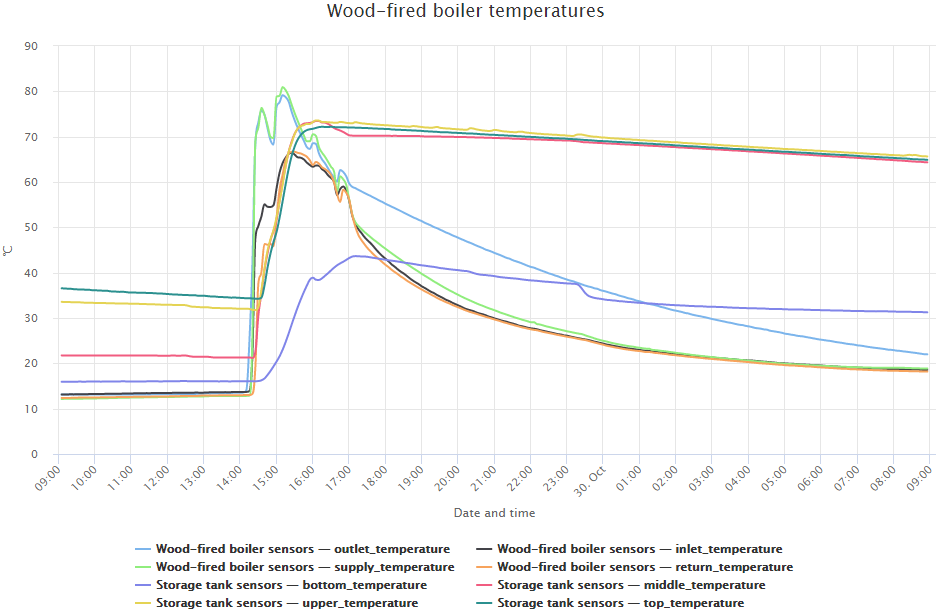
Display daily, weekly, monthly and yearly charts of the (in source) specified nodes and fields with auto-refresh feature on your website.
HTML source
https://github.com/IoTGuruLive/web-api-examples/blob/master/complex-chart.html
Live demo
https://iotgurulive.github.io/web-api-examples/complex-chart.html