This tutorial will show you how to use IoT Guru Cloud to monitor the health of your Raspberry Pi and alert you when something is wrong.
At the end of this tutorial, you will run a Python script every five minutes using crontab to send your Raspberry Pi’s temperature, free disk space and memory usage to the cloud using our REST API.
Step 1
First of all, we suggest to read our basic tutorials about devices, nodes and fields:
- Devices: https://iotguru.cloud/tutorials/devices
- Nodes: https://iotguru.cloud/tutorials/nodes
- Fields: https://iotguru.cloud/tutorials/fields
Step 2
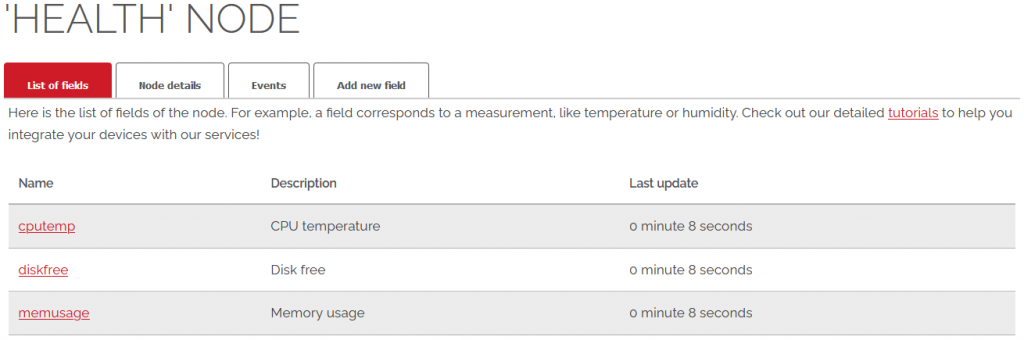
Create a device of your Raspberry Pi, create a node of this device, and name it as ‘Health’, and create three fields like this:
Step 3
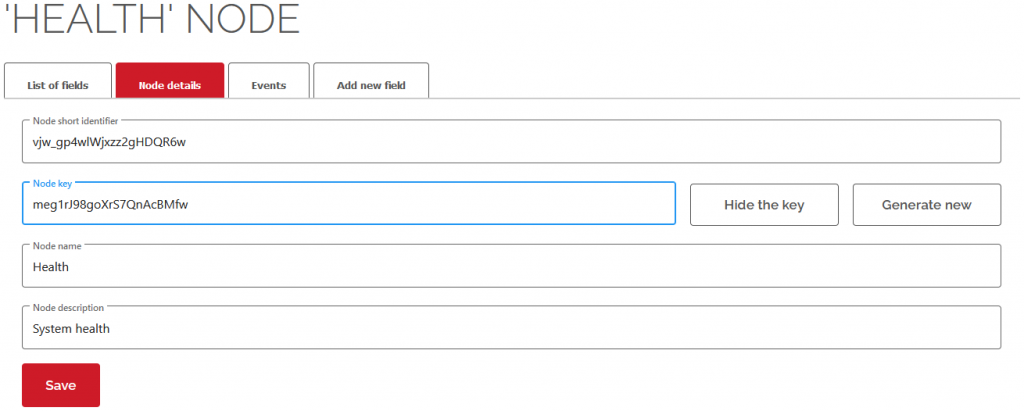
Copy the node key of the ‘Health’ node (by click ‘Show the key’ button).
Step 4
Create a raspi_health.py file with your favorite editor and copy-paste this code below. Don’t forget to replace the nodeKey value with your node key!
import os
import ssl
import re
import subprocess
import urllib.request

# Replace with your nodeKey:
nodeKey = 'meg1rJ98goXrS7QnAcBMfw'

# DO NOT EDIT BELOW, unless you trust yourself

cpu_temp_endpoint  = 'https://api.iotguru.cloud/measurement/create/' + nodeKey + '/cputemp/'
disk_free_endpoint = 'https://api.iotguru.cloud/measurement/create/' + nodeKey + '/diskfree/'
mem_usage_endpoint = 'https://api.iotguru.cloud/measurement/create/' + nodeKey + '/memusage/'

#!/usr/bin/env python3

def getRAMinfo():
    p = os.popen('free')
    i = 0
    while 1:
        i = i + 1
        line = p.readline()
        if i==2:
            RAM_stats = line.split()[1:4]
            RAM_total = int(RAM_stats[0])
            RAM_free = int(RAM_stats[2])
            RAM_freeperc = int(RAM_free / RAM_total * 100)
            return RAM_freeperc

def postData(endpoint, value):
    gcontext = ssl.SSLContext()
    url = endpoint + str(value)
    req = urllib.request.Request(url)
    resp = urllib.request.urlopen(req, context=gcontext)
    respData = resp.read()
    print(respData)

cputemp = subprocess.Popen('cat /sys/class/thermal/thermal_zone0/temp', shell=True, stdout=subprocess.PIPE).stdout.read().decode('utf-8')
cputemp = int(int(cputemp) / 1000)
postData(cpu_temp_endpoint, cputemp)

usedspace = subprocess.Popen('df --output=pcent / | awk -F\'%\' \'NR==2{print $1}\'', shell=True, stdout=subprocess.PIPE).stdout.read().decode('utf-8')
freespace = 100 - int(usedspace)
postData(disk_free_endpoint, freespace)

freeram = getRAMinfo()
postData(mem_usage_endpoint, freeram)
Step 5
Test the script in the command line, you will get something like this:
> python3 raspi_health.py
b'{"epoch":18567,"nodeId":"f1cf3da0-1c34-11eb-be3c-3f829e309568","nodeShortId":"vjw_gp4wlWjxzz2gHDQR6w","field":"cputemp","created":"4eb38920-1c37-11eb-be3c-3f829e309568","floatValue":32.0,"textValue":null}'
b'{"epoch":18567,"nodeId":"f1cf3da0-1c34-11eb-be3c-3f829e309568","nodeShortId":"vjw_gp4wlWjxzz2gHDQR6w","field":"diskfree","created":"4ed9d5d0-1c37-11eb-b075-c16b57e52174","floatValue":16.0,"textValue":null}'
b'{"epoch":18567,"nodeId":"f1cf3da0-1c34-11eb-be3c-3f829e309568","nodeShortId":"vjw_gp4wlWjxzz2gHDQR6w","field":"memusage","created":"4f113980-1c37-11eb-be3c-3f829e309568","floatValue":44.0,"textValue":null}'
Step 6
Add the script to the end of your crontab, by using the crontab -e command:
*/5 * * * * python3 /home/pi/raspi_health.py > /dev/null 2>&1Step 7
Check out the chart of one of your field:
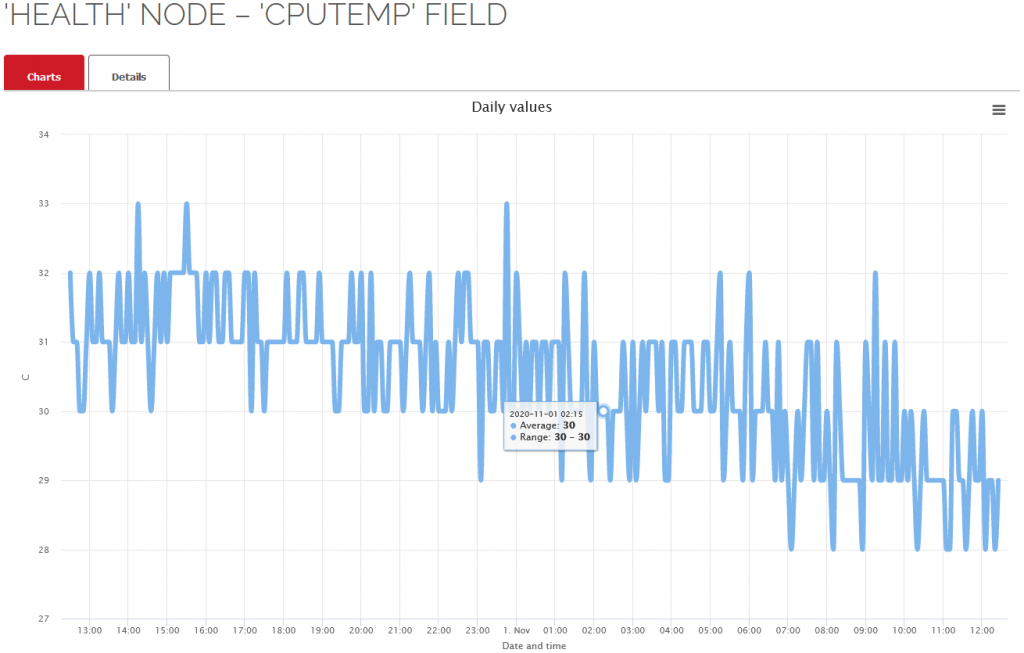
That’s all, folks, enjoy your charts of your Raspberry Pi. 🙂
Based on Jasonb’s forum post: tutorial-monitor-health-of-your-raspberry-pi
Thank you, Jason! 🙂